|
 Softzymics has adopted Igor Pro 6, the
leading technical computing program for Macintosh and Windows, to create a dedicated enzyme kinetics program–VisualEnzymics. Igor Pro 6 is a full powered technical
computing environment with built-in nonlinear regression, 2D
and 3D graphs of unlimited complexity, data tables,
notebooks, layouts, drawing layer, customizable panels, and
programmability.
Igor Pro 6 uses the metaphor of an experiment to combine
these elements into a single file. VisualEnzymics is a
standard Igor Pro 6 experiment file where all the enzyme
kinetic equations and graphs are programmed for your
convenience. All you have to do is enter your data and
select your analysis.
Igor Pro 6 offers an impressive suite of capabilities
that can handle the most demanding scientific data analysis
problems, from complex graphing and image handling to
multidimensional global fitting. VisualEnzymics utilizes
many of these capabilities for analyzing enzyme kinetic
data, and because VisualEnzymics was developed in Igor Pro
6, there is no limit to the future development of
VisualEnzymics.
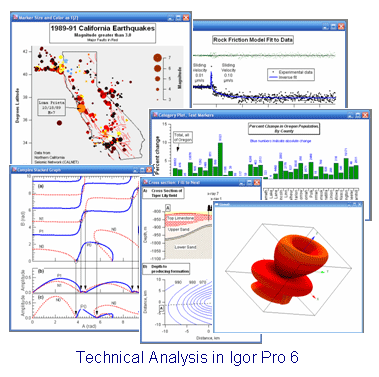
Tour some of the outstanding capabilities of Igor Pro 6 .
. .
|
 |
|
Programming l
Nonlinear Regression l
Graphing l
Layouts l
Tables
l Notebooks l
Panels |
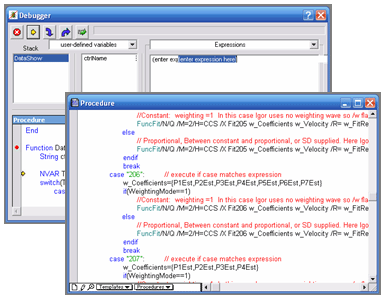 |
Igor Pro 6 offers an integrated development environment
that gives you the ability to create a custom
interface in any experiment file. Any type of
analysis that uses Igor Pro's built-in mathematical
or graphing capabilities can be reduced to code,
compiled, and saved for use by other scientists.
Procedures can be written in Igor Pro's structured
programming language, or, new analysis panels an be
created by adding control objects to a blank control
panel. Igor Pro 6 automatically generates procedure
code when panels and graph windows are closed. The
code then can be viewed and modified in Igor Pro's
Procedure Window. Igor Pro's extensive 2,489 page
online manual documents all the commands,
operations, mathematical functions, statistical
functions, and control operations needed to build a
complete interface.
For highly specialized computational needs, Igor Pro 6
can be linked to external code files created in C++.
Igor Pro 6 also offers a special toolkit for
instrument hardware control though I/O boards.
Igor Pro 6 functionality and interface are identical on
Macs and PCs. Experiment files are interchangeable
and can be moved to any computer running Igor Pro 6.
|
|
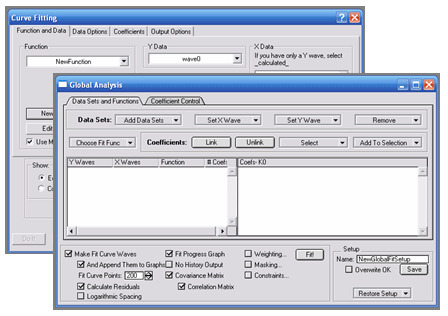
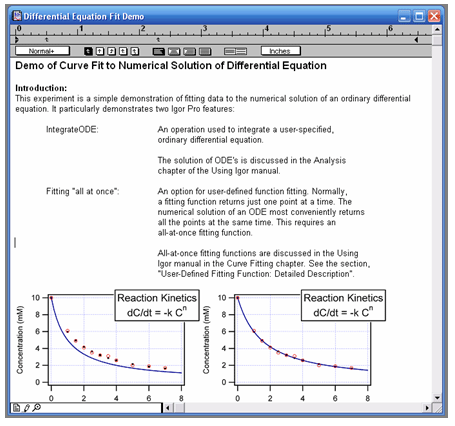
Igor Pro 6 offers built-in nonlinear regression to user
defined equations. The number of parameters and
independent variables is virtually unlimited.
Regression analysis automatically calculates the
model curve, curve fit residuals, model confidence
and predictions bands, and adds these to graphs of
experimental data. Regression analysis also
calculates the error estimates and confidence limits
of the model parameters. Model parameters can be
fixed or floated, models can be fit to subsets of
the data, and various weighting factors can be added
to the fitting process. User defined fitting
functions can be arbitrarily complex, involving
conditionals, loops, convolutions, or differential
equations. Global analysis can be used to fit
multiple data sets to one or more equations with
linked parameters. Multi-dimensional data can be fit
in up to four dimensions. Igor Pro 6 uses the
Levenberg-Marquardt algorithm with least squares
optimization, or can be set to optimize absolute
differences for robust fitting. For data with error
in both the dependent and independent variables,
Igor Pro 6 offers orthogonal distance regression.
Also, fitting functions can be minimized by
simulated annealing to find global minima.
Igor Pro 6 meets the most demanding needs for data
analysis.
|
|
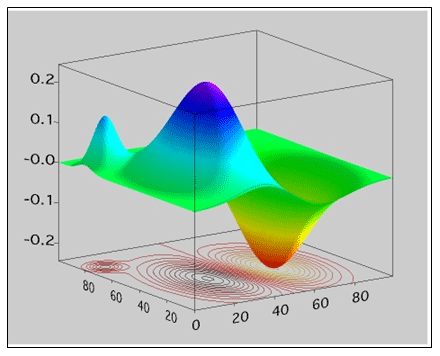 |
Igor Pro 6's internal data structures are highly
optimized for mathematical analysis and display of
2D and 3D matrix type data. In 2D space, Igor offers
highly customizable X-Y plots, contour plots, image
plots, and category plots, and in 3D space offers 3D
scatter plots, volume plots, isosurfaces, voxelgrams,
object plots, and volume slices. Igor provides the
user with complete control over all plot elements so
that plots can be customized in unlimited ways.
Graphs also have a drawing layer where custom shapes
and objects can be drawn and added to graphs. Any
type of imported image also may be added to graphs.
Graph annotations include symbol tags, text boxes,
and dynamic tags that change with data values.
Graphs can be fine-tuned to meet the standards of
any type of scientific publication. Multiple graphs
can be combined in layout pages or can be exported
to presentation programs and manuscripts. Graphs can
be embedded in other graphs or in notebooks or in
panels. Special commands can be used to slide graph
contents in the graph window, or rotate live 3D
volumes. Graph elements are fully programmable.
Graphs display data changes instantaneously as users
execute math calculations on data or manually change
data points. Combine unlimited numbers of curves and
axes on a graph, and create unlimited numbers of
graphs in an experiment file.
|
|
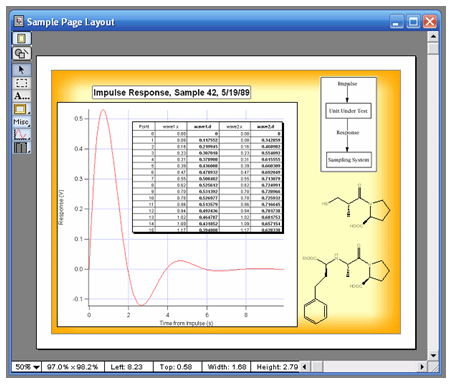
Igor Pro 6 offers layout pages for creating combined
images that can be exported to presentation programs
and word processors. Layouts consist of a graphics
layer and a drawing layer. The graphics layer can
contain graphs, text, and tables. The drawing layer
can contain objects created with a panel of drawing
tools that includes lines and shapes with full
control of colors, lines, and fills. Objects in the
drawing layer can be grouped, aligned, distributed,
and layered on top of other objects. Precision
placement can be achieved with grid coordinates that
are displayed in real time as objects are moved in
the layout. Layouts can be tinted to highlight
results. Images from other programs can be pasted
into the graphics or drawing layer. The entire
layout can be exported as an Enhanced Metafile,
Bitmap, or PNG image. Layouts can be used as a
template to illustrate the combined results from an
experiment. When a new experiment has been
performed, add the new data to a table, and the
table and graph in the layout automatically update.
Layouts can be saved in a macro format to recreate
all the customized features of the layout. Macros
can be modified and used in any Igor Pro 6
experiment to create similar layouts. Macro code can
be linked to user created control panels to organize
and manage layouts from a central control panel.
|
|
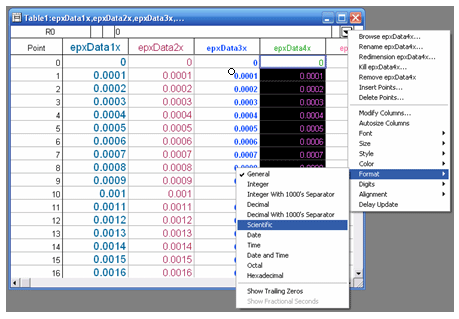 |
Igor Pro 6 uses tables to manage all experimental
data. The basic unit of data in Igor Pro 6 is a
waveform, or wave. A wave can be a single number or
a list of numbers. Waves can be created in one, two,
three, and four dimensions, where each dimension
corresponds to columns, layers, and chunks of data.
The numbers in a wave are displayed in tables as a
column of numbers. The numbers can be edited in the
table, or can be modified as a result of
mathematical functions that perform calculations on
wave data. All graphs that display wave data are
instantly updated as the waves are changed. Tables
can be formatted in all available colors, fonts, and
type sizes. Popup menus in tables can be used to
format wave data as integers, scientific numbers,
date and time, or hexadecimal numbers. Popup menus
also can be used to add and delete data, browse
waves, redimension waves, and rename waves. Tables
can be inserted as sub-windows into panels and
graphs, or added to layouts are table objects.
Tables can be saved in macro format to recreate
tables with custom formatting. Table macros can be
transferred to other Igor Pro 6 experiments to
create similar table formatting.
|
|
Igor Pro 6 offers a special document editor that is
implemented as a Notebook window. Each experiment
can have one or more Notebooks to describe the work
done in the experiment. A Notebook window is similar
to a word processor in that it provides the user a
way to write and format text in a document window.
However, the document window also can contain graphs
and tables from the experiment, or any type of image
that can be copied and pasted from other programs
into Igor Pro 6. Images pasted into Notebooks can be
converted to PNG format for high quality display on
monitors and in print. Embedded objects can be
updated to reflect current data in the Igor
experiment. Special link commands in the Notebook
text allow computational functions to be executed by
clicking on the text. Notebook files can be saved as
part of Igor Pro 6 experiments, or can be saved as
separate files in TXT, HTM, or RTF formats.
Notebooks also can be programmed in Igor Pro's
compiled language. This gives the user the ability
to format computational results in procedure code
and generate formatted text as output from
calculations. Notebooks also can be time stamped to
document experiments. In addition, Notebooks can be
used to create Help files to explain the purpose of
an experiment and how the experiment analyzes the
data. Specially created Help files are searchable in
Igor Pro's Help window.
|
 |
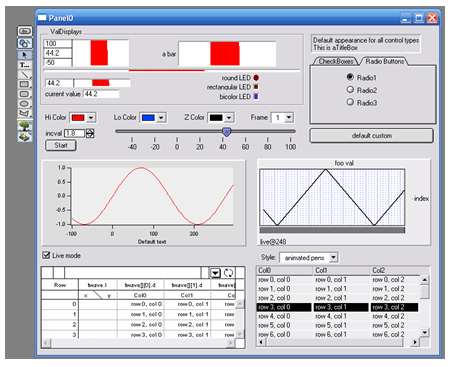 |
Igor Pro 6 offers custom control panels to speed
development of unique applications for distribution
to other scientists. Blank control panels can be
added to any experiment and then programmed by
adding various types of standard controls. The
available controls in Igor Pro 6 include buttons,
checkboxes, popup menus, value displays, set
variable displays, tab groups, title boxes, group
boxes, sliders, and list boxes. Each type of
built-in control has its own associated data
structure and event status. Control objects can be
defined in control dialog windows, or can be
programmed in code. When panel windows are closed,
Igor Pro 6 automatically generates all the necessary
code to recreate the panel. Panels also can contain
graphs, tables, and images. Highly functionalized
control panels can be created to accept user input
for complex calculations or to control the display
of graphs and data. Igor Pro 6 comes with numerous
example experiments to illustrate the use of control
panels and individual controls.
|
|
|